Table of contents
- What is the free cash flow margin?
- How is the free cash flow margin calculated?
- What does the free cash flow margin mean?
What is the free cashflow margin?
The free cash flow margin is the ratio of free cash flow to sales. This allows the profitability of a company to be assessed. The ratio is very meaningful, as sales and free cash flow are almost independent of other key financial figures and are difficult for management to embellish. The free cash flow margin formula is
Free cash flow margin = free cash flow / sales
Free cash flow provides information on how much of the profit generated at the end of an economic period is available to a company for dividend distributions, share buybacks or debt repayment.
Revenue is the sum of all income generated by a company, e.g. for its products or services.
In general, the higher the free cash flow margin, the more profitable the company is.
The calculation can be based on different time periods (e.g. last financial year or TTM). TTM is the abbreviation for “Trailing Twelve Months” and reflects the free cash flow and revenue over the last 12 months or 4 quarters.
How is the free cash flow margin calculated?
The free cash flow is divided by the revenue for the same period.
Calculating the free cash flow margin:
The calculation of the free cash flow margin (TTM) of Microsoft shares as of September 13, 2024 is shown as an illustration:
.jpg?width=624&height=139&name=Berechnung%20Free%20Cashflow%20Marge%20(2).jpg)
In the StocksGuide, you can find the free cash flow margin for each share in the “Overview” tab under Financial data in the cash flow statement.
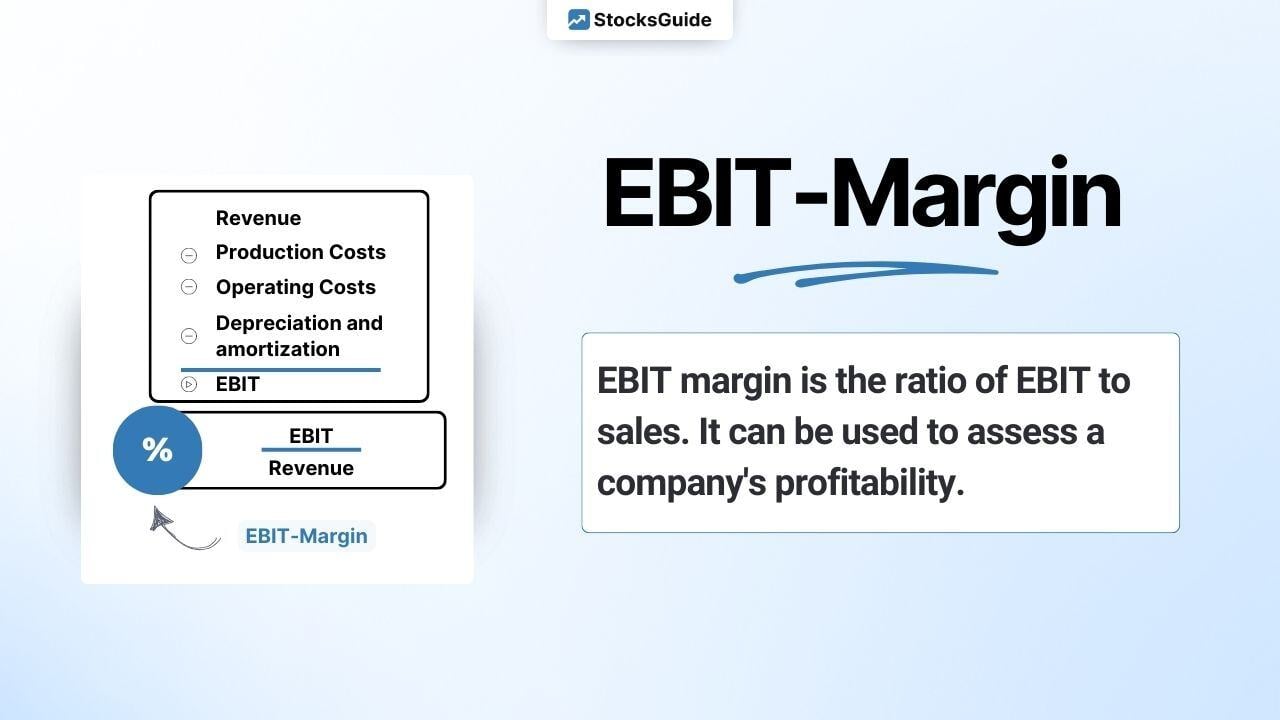
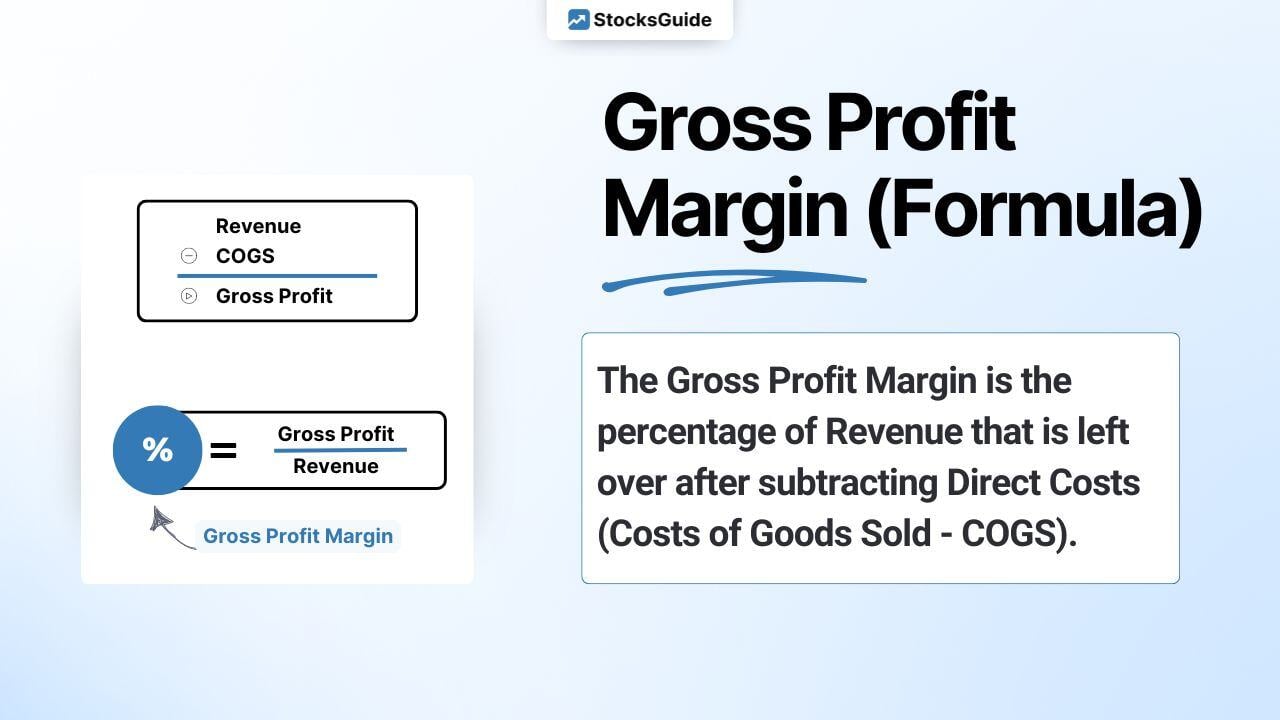
Note: In addition to the development of the free cash flow margin, you should also track the gross and EBIT margins. Rising free cash flow margins are positive.
What does the free cash flow margin mean?
The free cash flow margin is the percentage of sales that is available to the company after deducting all costs and investments.
This gives you a very good overview of the profitability and financial stability of a company.
The higher the free cash flow margin, the more capital the company has available for dividend payouts, share buybacks or debt repayment.
Development of the free cash flow margin
You should keep an eye on the development of the free cash flow margin. In the best case scenario, the free cash flow margin can be increased or kept constant. Furthermore, a comparison should always be made with direct competitors from the same sector.
The following figure shows the development of the free cash flow margin of Microsoft shares in comparison to other companies:
Warning signal: A falling free cash flow margin indicates that profitability is declining. In this case, the reasons for this should be investigated. In the case of strategically important investments, a falling free cash flow margin is not necessarily a negative signal.
Rule of 40
The free cash flow margin is part of the Rule of 40, which is widely used to value growth companies. The Rule of 40 is a simple way of assessing the efficiency of a company's growth. The Rule of 40 results in the efficiency score or Rule of 40 score. The formula is:
Rule of 40 (%) = sales growth (%) + free cash flow margin (%)
An efficiently growing company should achieve a Rule of 40 score of at least 40 percent over several years. A company with a negative free cash flow margin can still fulfill the Rule of 40 through high sales growth.
What is a good free cash flow margin?
Whether the free cash flow margin under consideration is good or bad depends on other influencing factors, e.g:
- long-term development of the free cash flow margin
- Free cash flow margin compared to the competition
- Future prospects of a company's industry
- Position of the company in this market
- Speed of growth
- Business model
Top 10 stocks with the highest free cash flow margin worldwide
The following table shows the top 10 large and mid-cap stocks with a high free cash flow margin from the software/Internet sector:
| Stock | Market Capitalization | Free-Cash-Flow margin |
| 1. Meta Platforms (Facebook) | $1.49t | 30.71% |
| 2. Palantir Technologies Inc | $276.82b | 42.32% |
| 3. Salesforce | $264.26b | 32.81% |
| 4. Intuit | $182.80b | 32.81% |
| 5. Adobe | $163.35b | 41.71% |
| 6. Applovin | $111.17b | 49.33% |
| 7. London Stock Exchange | $79.37b | 37.64% |
| 8. Airbnb | $78.41b | 38.78% |
| 9. Netease | $66.90b | 36.37% |
| 10. Coinbase Global, Inc. | $65.43b | 46.94% |

-png.png?width=1126&height=461&name=Bildschirmfoto%202025-05-12%20um%2016-28-50%20(2)-png.png)
-png.png?width=1100&height=674&name=Bildschirmfoto%202025-05-12%20um%2016-33-08%20(2)-png.png)

%20%F0%9F%87%BA%F0%9F%87%B8.jpg)

