In the video I explain how you can use the charts tool for your share analyses. The graphical presentation of key figures saves you a lot of time and gives you a quick overview of a company.
In addition to margin & sales trends and popular valuation metrics such as EV/Sales and KUV, you can access over 40 different key figures in the Charts Tool. In addition to various key figures, you can also view different time periods in the fundamental charts. For example, you can view the development of the key figures in the last month, but also on the basis of the last 5 years.
In addition, the charts offer the option of choosing between three different display options:
Original: Shows the development of the selected key figure in absolute figures (e.g. share price = €100)
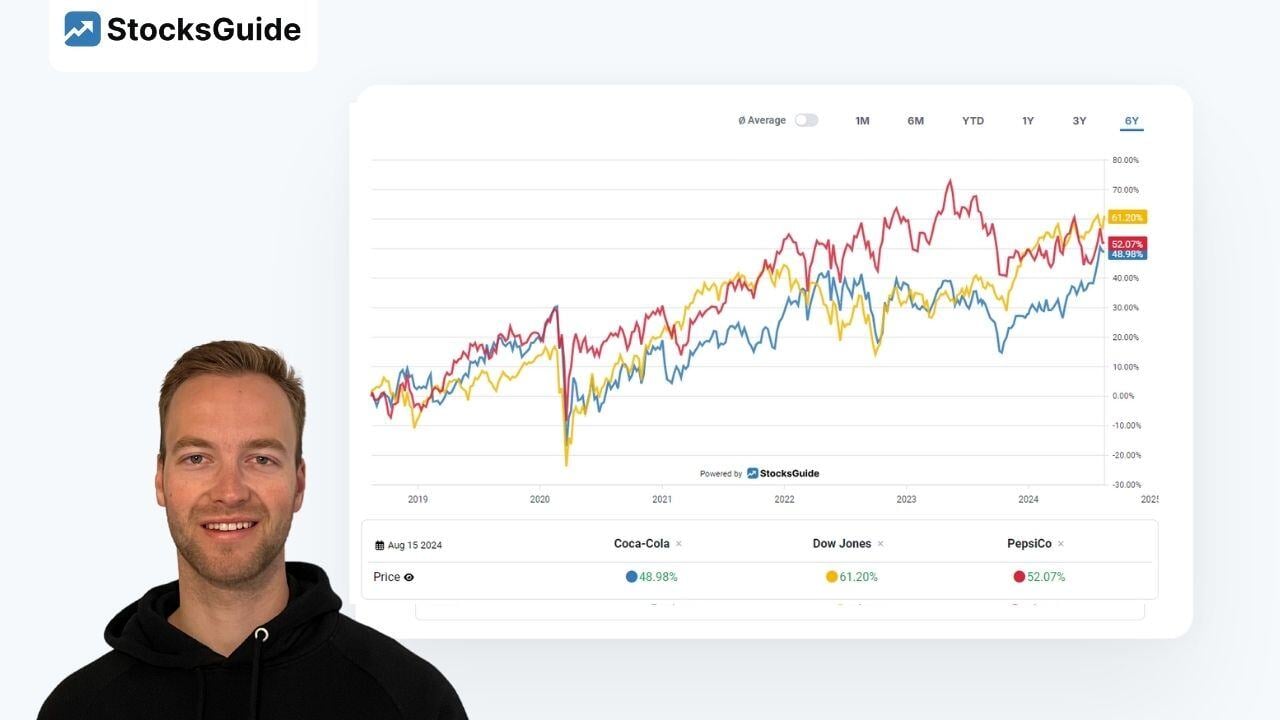
Normalized: Shows the percentage change of the selected key figures in the displayed period (e.g. share price ➡️ -10% in the last year)
Underwater: Shows the percentage distance of the current value of the key figure in relation to the last high (if a share had a price/sales ratio of 10 3 years ago and now has a price/sales ratio of 5, the charts tool shows -50%)
Last but not least, you can easily compare stocks with indices using the aktien.guide charts tool.
Important links:
Charts
To StocksGuide
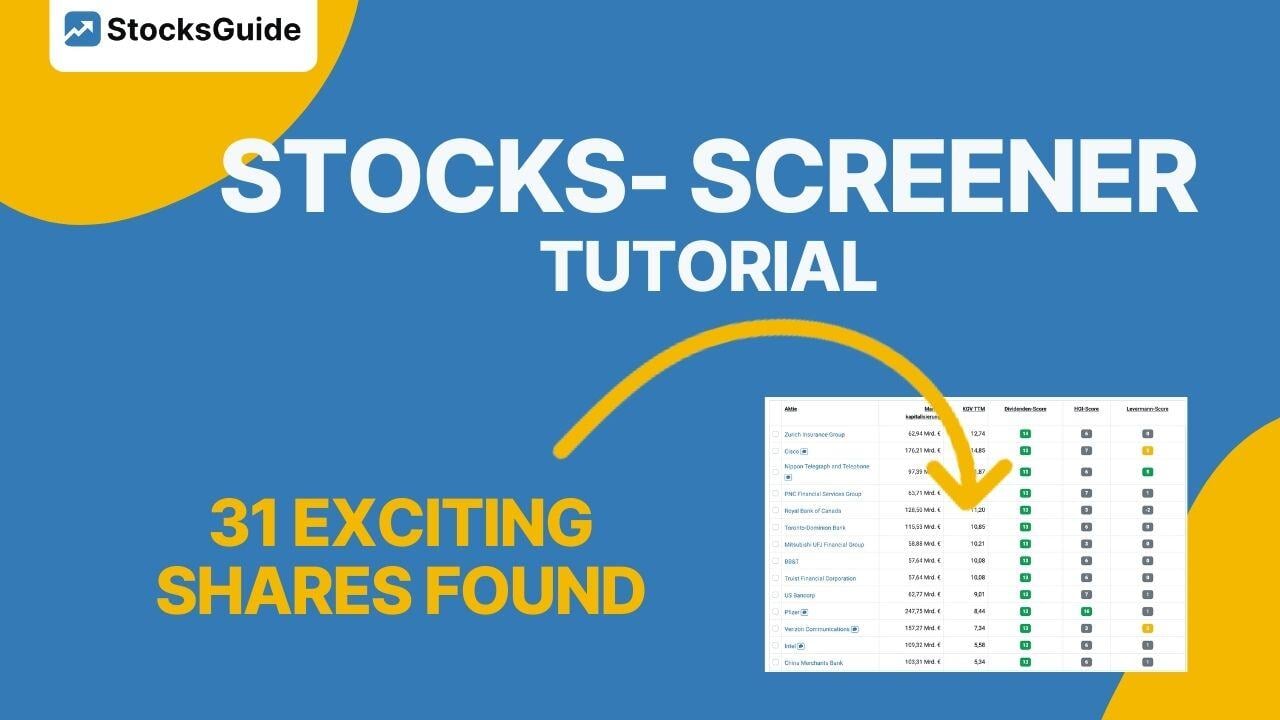
StocksGuide Screener
EV/Sales explained
Gross margin explained
Dec 22, 2023 | Videos
In this video we explain how you can use the Charts Tool for your stock analyses. The graphical presentation of the key figures saves you a lot of time and gives you a quick overview of a company.

Written By: Lukas Langer
Lukas Langer has a master's degree in industrial engineering. During his studies, he already gained practical experience in a DAX company and in management consulting. As an enthusiastic private investor, his goal is to help investors make better investment decisions with StocksGuide.