Table of Contents
- What is the Enterprise Value/Sales Ratio?
- How is the Enterprise Value/Sales Ratio Calculated?
- What Does the EV/Sales Ratio Indicate?
- Advantage of EV/Sales over P/S Ratio
What is the Enterprise Value/Sales Ratio?
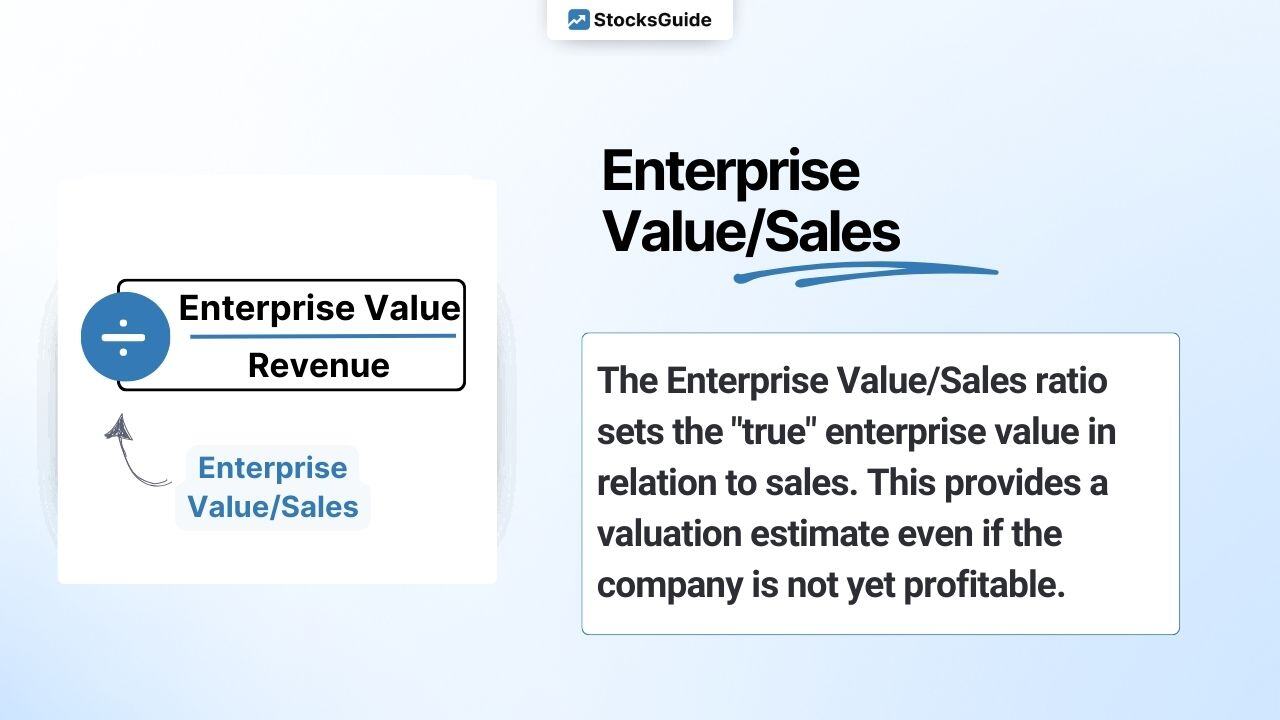
The Enterprise Value/Sales Ratio (EV/Sales) compares a company's enterprise value (EV) to its sales (revenue). It’s a key metric for evaluating a company's stock, even if it hasn't yet turned a profit.

In general, the lower the EV/Sales, the more favorably valued the share is.
How is the Enterprise Value/Sales Ratio Calculated?
Enterprise value is divided by sales or revenue (TTM). TTM is the abbreviation for “Trailing Twelve Months”. By taking the last 12 months into account, the most recent figures from the last 4 quarterly reports are always taken into account.
Enterprise Value
The Enterprise Value is calculated by adding the debt to the market capitalization and subtracting the cash position (enterprise value simply explained).

Calculate the Enterprise Value/Sales ratio (EV/Sales):
The calculation of the EV/Sales of the Spotify share as at June 02, 2025 is shown as an illustration:

The Spotify share is currently valued at an EV/Sales of 4. For comparison, you can/should take a look at the valuation in a historical comparison and, if necessary, compare it with competitors:
-png.png?width=868&height=511&name=Bildschirmfoto%202025-06-02%20um%2019-13-23%20(2)-png.png)
According to the High Growth Investing strategy, the following points are awarded for the EV/Sales indicator:

The Spotify share thus receives 3 points, as the EV/Sales is below 8.
Attention! Depending on the industry and business model as well as the future prospects of the respective company, the EV/Sales can vary greatly.
The financial market tends to award a particularly high EV/Sales to companies that can generate high profitability with their business model, e.g. measured by gross margin or free cash flow. This applies, for example, to software manufacturers (typically gross margins of over 70%) compared to car manufacturers (typically gross margins of less than 30%).
The car manufacturers Daimler and BMW are valued significantly lower than the cyber security stocks Crowdstrike and Zscaler, for example.
-png.png?width=1080&height=122&name=Bildschirmfoto%202025-06-02%20um%2019-16-30%20(2)-png.png)
What Does the EV/Sales Ratio Indicate?
The Enterprise Value/Sales ratio (EV/Sales) is an important indicator for assessing the valuation of companies/shares. A high EV/Sales indicates a high valuation and a low EV/Sales indicates a cheap valuation.
But beware: a low EV/Sales does not necessarily indicate a good investment! It is therefore important to look at the EV/Sales in the overall context and not in isolation. Visually favorable EV/Sales values, for example, often go hand in hand with low growth prospects. Other key figures and the historical development of EV/Sales should therefore also be considered.
Which Enterprise Value/Sales ratio can be considered favorable also depends on other influencing factors, e.g:
- Stability of sales
- Sales mix (recurring revenues are valued particularly highly)
- Future prospects of a company's industry
- Position of the company in this market
- Speed of growth
- Business model
Advantage of EV/Sales over P/S Ratio
Many investors prefer EV/Sales over the Price-to-Sales (P/S) ratio because EV provides a more accurate company valuation by adjusting market capitalization for debt and cash.
The best tech stocks with low EV/sales worldwide
The following table shows large and mid-cap stocks from the software/internet sector with low EV/sales. Here you can find the table in the screener and add your filters: The best tech stocks
| Stock | Market Capitalization |
EV/Sales | FCF Margin |
| Alphabet | $2.0t | 5.4 | 21% |
| $1.7t |
9.6 | 31% | |
| Oracle | $474b |
9.9 | 10% |
| $353b |
8.7 | 16% | |
| Salesforce | $253b |
6.5 | 33% |
| Adobe | $176b |
7.9 | 42% |
| Uber Technologies | $173b |
3.9 | 17% |
| Spotify Technology | $135b |
6.9 | 16% |
| Automatic Data Processing | $133b |
6.6 | 21% |
| $132b |
5.8 | 29% |

%20%F0%9F%87%BA%F0%9F%87%B8.jpg)
%20%F0%9F%87%BA%F0%9F%87%B8.jpg)