%20%F0%9F%87%BA%F0%9F%87%B8.jpg)
Table of contents
- What is the price/sales ratio (P/S ratio)?
- How is the price/sales ratio (P/S ratio) calculated?
- What does the price/sales ratio (P/S ratio) tell us?
- What are the advantages and disadvantages of the price/sales ratio?
What is the price-to-sales ratio (P/S ratio)?
The price-to-sales ratio (P/S ratio) describes the ratio of share price to sales per share. The P/S ratio (Price to Sales Ratio or P/S) is a key figure for the valuation of a company.
In general, the lower the P/S ratio, the more favorably valued the share is.
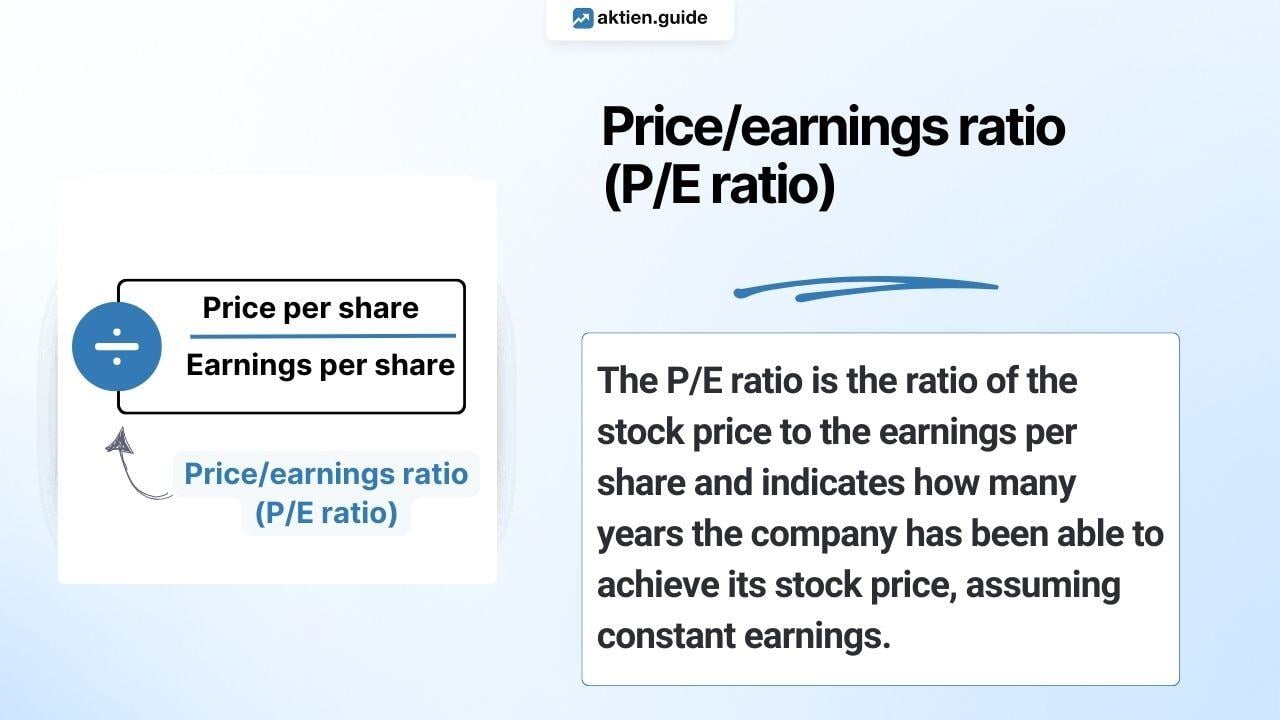
The price-to-sales ratio can also be used to value companies that are not yet making a profit. This is not possible with the price/earnings ratio (P/E ratio), as the calculation is based on earnings per share (EPS).
Accordingly, the P/E ratio is made up of 2 components:
(1) share price divided by (2) sales per share
Or to put it another way:
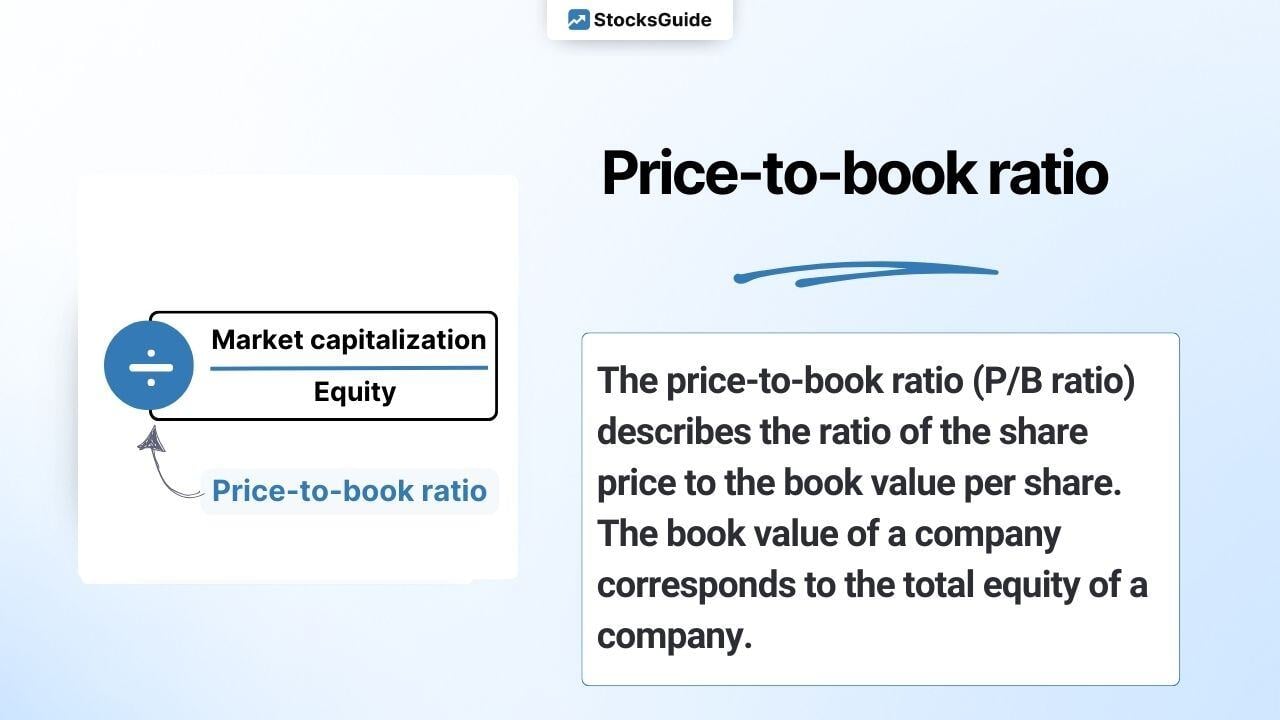
(1) market capitalization divided by (2) total sales
Since sales can hardly be manipulated by management (e.g. in comparison to EBIT), this key figure is well suited for valuing companies.
However, it is questionable whether the share price or market capitalization is also a good basis for valuing companies. More on this below.
How is the price/sales ratio (P/S ratio) calculated?
The price/sales ratio (P/S ratio) puts the share price in relation to sales per share over the last 12 months. In other words, the market capitalization is divided by the turnover of the last 12 months.
Calculating the price/sales ratio (P/S ratio):
The calculation of the P/S ratio (TTM) of Tesla shares as of September 13, 2024 is shown as an illustration:

The Tesla share is currently valued at a high P/E ratio of 7.7. For comparison, you can/should take a look at companies from the same sector:

The image above clearly shows that companies from the supposedly same industry can be valued very differently.
What does the price/sales ratio (P/S ratio) tell us?
The price/sales ratio (P/S ratio) allows conclusions to be drawn about the valuation of a share or a company. A high P/S ratio indicates a high valuation and a low P/S ratio indicates a favorable valuation.
But be careful: a low P/S ratio does not necessarily indicate a good investment! It is therefore important to look at the P/S ratio in the overall context and not in isolation. Visually favorable P/E ratios often go hand in hand with low growth prospects, for example. Other key figures and the historical development of the P/S ratio should therefore also be considered. Furthermore, the P/S ratio is not applicable to companies in the financial sector.
Which price/sales ratio is to be considered favorable also depends on other influencing factors, e.g:
- Stability of earnings
- Future prospects of a company's sector
- Position of the company in this market
- Speed of growth
- business model
What are the advantages and disadvantages of the price/sales ratio?
3 Advantages
1. easy to understand/calculate:
The two components of the P/S ratio, market capitalization and sales, are easy to understand. Market capitalization represents the market capitalization of a company (number of shares x share price). Turnover represents the sum of all revenues of a company, e.g. for its products or services.
2. turnover cannot be manipulated:
Turnover can hardly be manipulated by management, especially in comparison to profit or EBIT, as it is almost independent of other key financial figures. EBIT, on the other hand, is subject to accounting policy valuation leeway.
3. applicable to companies without profit:
The P/E ratio is also easy to calculate for a company that does not yet generate a profit. The price/earnings ratio (P/E ratio), probably the best-known key figure for valuing companies, is not applicable in this case.
3 Disadvantages
1. market capitalization as a key figure is questionable:
Compared to enterprise value (EV) , market capitalization does not represent the “true” value of the company. The EV is essentially the market capitalization adjusted for debt and cash. It is therefore more meaningful. We therefore recommend using the EV-sales ratio instead of the P/S ratio.
2. no conclusions about the financial situation of the company:
A company with a low P/S ratio may be highly indebted and on the verge of insolvency. Therefore, the debt ratio should also be taken into account when analyzing shares.
3. no consideration of margins:
The P/S ratio allows an initial conclusion to be drawn about the valuation of a company. However, the margins and their development are not considered. Therefore, the gross margin or EBIT margin (ideally over time), for example, should also be considered.
Top 10 stocks with low price-to-sales ratio (P/S) worldwide
The following table shows mid and large cap stocks with the lowest price/sales ratio (P/S ratio) worldwide. Only companies with sales growth of over 10% in each of the last 3 years were included here. Shares from the financial sector were not considered.
| Stock | Price-to-sales ratio |
| Cardinal Health | 0.11 |
| Nissan Motor | 0.12 |
| TUI | 0.13 |
| Korea Electric Power Corporation | 0.14 |
| Mazda Motor | 0.14 |
| Cencora | 0.17 |
| Sendas Distribuidora S.A. - ADR | 0.18 |
| Lithia Motors, Inc. Class A | 0.22 |
| EchoStar Corporation Class A | 0.26 |
| McKesson | 0.26 |

%20%F0%9F%87%BA%F0%9F%87%B8.jpg)