Table of Contents
- What is the Enterprise Value/Free Cash Flow Ratio (EV/FCF)?
- How is the Enterprise Value/Free Cash Flow Ratio Calculated?
- What Does the Enterprise Value/Free Cash Flow Ratio Indicate?
- Advantages of EV/FCF
What is the Enterprise Value/Free Cash Flow Ratio (EV/FCF)?
The EV/FCF ratio compares a company's true value (Enterprise Value) to its Free Cash Flow. Generally, a lower EV/FCF indicates a cheaper stock valuation. It is a metric for assessing a company's valuation (entity multiplier).
How is the enterprise value/free cash flow ratio (EV/FCF) calculated?
The enterprise value is divided by the free cash flow (TTM). TTM is the abbreviation for “Trailing Twelve Months”. By taking into account the last 12 months, the most recent figures from the last 4 quarterly reports are always taken into account.
Enterprise Value
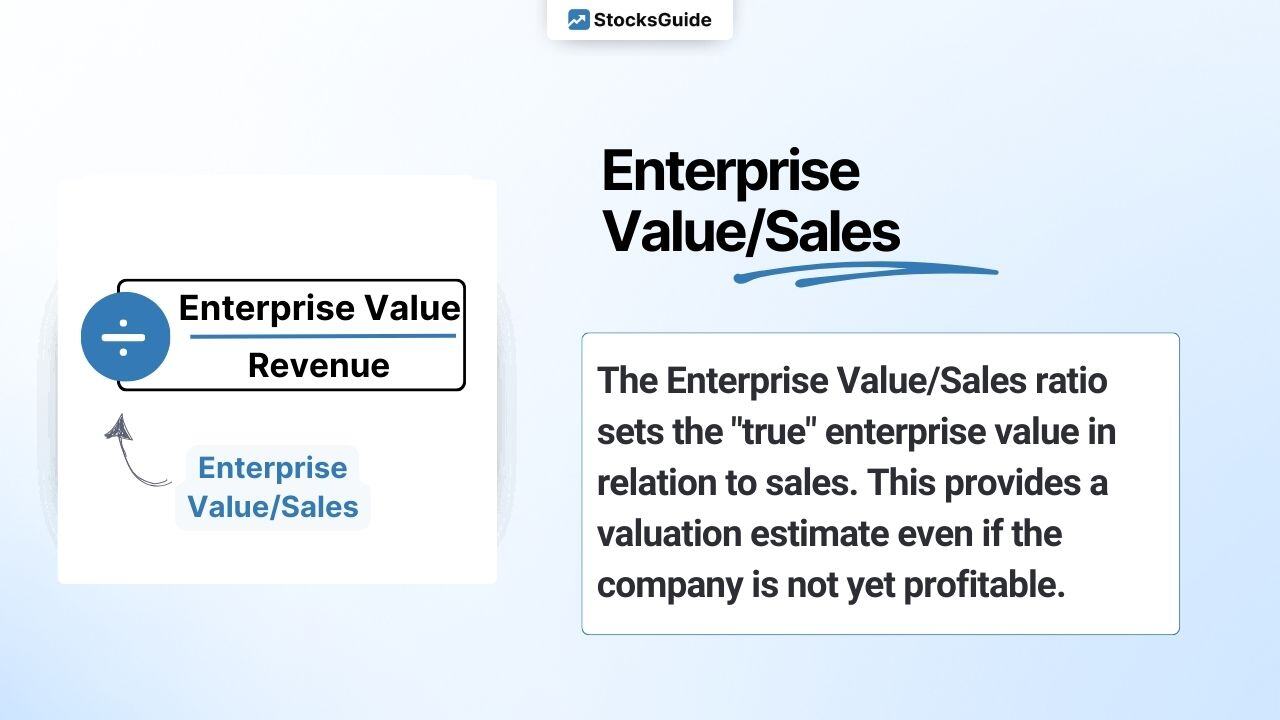
Enterprise value is calculated by adding debt to market capitalization and subtracting cash (Enterprise Value simply explained).
Free cash flow
The term free cash flow comes from the English-speaking world and literally means free cash flow (free cash flow simply explained). In simple terms, free cash flow provides information on how much of the profit generated is available to a company for profit distribution or debt repayment at the end of an economic period.
Calculate enterprise value/free cash flow ratio (EV/FCF):
To illustrate, the calculation of the EV/FCF of The Home Depot stock as of June 10, 2025 is shown:

The Home Depot share is currently valued with an EV/FCF of 27,27. For comparison, you can/should take a look at the valuation in historical comparison and, if necessary, compare it with competitors:
What does the enterprise value/free cash flow ratio (EV/FCF) indicate?
The Enterprise Value/Free Cash Flow Ratio (EV/FCF) is an important indicator for assessing the valuation of companies/shares. A high EV/FCF indicates a high valuation and a low EV/FCF indicates a cheap valuation.
But be careful: a low EV/FCF does not necessarily indicate a good investment! It is therefore important to look at the EV/FCF in the overall context and not in isolation. Visually favorable EV/FCF values often go hand in hand with low growth prospects, for example. Therefore, other key figures and the historical development of the EV/FCF should also be considered.
Which Enterprise Value/Free Cash Flow ratio is to be considered favorable also depends on other influencing factors, e.g:
- Stability of the free cash flow
- Future prospects of a company's industry
- Position of the company in this market
- Speed of growth
- business model
What are the advantages of the EV/FCF?
Many professional investors like to use the EV/FCF ratio instead of the P/E ratio in their analyses. The reason for this is the 3 advantages of EV/FCF over the P/E ratio:
- enterprise value = true enterprise value:
Enterprise value is essentially market capitalization adjusted for debt and cash. It is therefore more meaningful than market capitalization.
- free cash flow can hardly be manipulated:
Free cash flow can hardly be manipulated by management, especially in comparison to profit or EBIT. This is because it is almost independent of other key financial figures. EBIT, on the other hand, is subject to accounting policy valuation leeway.
- applicable to companies without profit:
The EV/FCF is also easy to calculate for a company that is not yet making a profit. The price/earnings ratio (P/E ratio), probably the best-known key figure for valuing companies, is not applicable in this case.
S&P 500 stocks by EV/FCF and P/E ratio
The following table shows S&P 500 stocks by enterprise value/free cash flow ratio (EV/FCF) and price/earnings ratio (P/E ratio).
| Stock | EV/FCF | PE-ratio |
| Super Micro Computer, Inc. | 722.06 | 23.31 |
| TKO Group | 610.43 | 76.68 |
| Texas Pacific Land Trust | 395.08 | 55.28 |
| Invitation Homes, Inc. | 381.28 | 42.55 |
| Equinix | 296 | 95.83 |
| Hewlett Packard Enterprise | 279.34 | 17.78 |
| Bank of America | 232.58 | 13.24 |
| Lamb Weston Holdings, Inc. | 219.19 | 21.66 |
| Micron Technology | 214.74 | 26.67 |
| United RentalsMid-America Apartment Communities | 194.08 | 31.39 |
%20%F0%9F%87%BA%F0%9F%87%B8.jpg)
-png.png?width=1070&height=494&name=Bildschirmfoto%202025-06-10%20um%2017-52-43%20(2)-png.png)


%20%F0%9F%87%BA%F0%9F%87%B8.jpg)