Table of contents
- What is the P/E-Ratio?
- Different types of P/E ratio
- How is the P/E ratio calculated?
- What does the P/E ratio mean?
What is the P/E ratio?
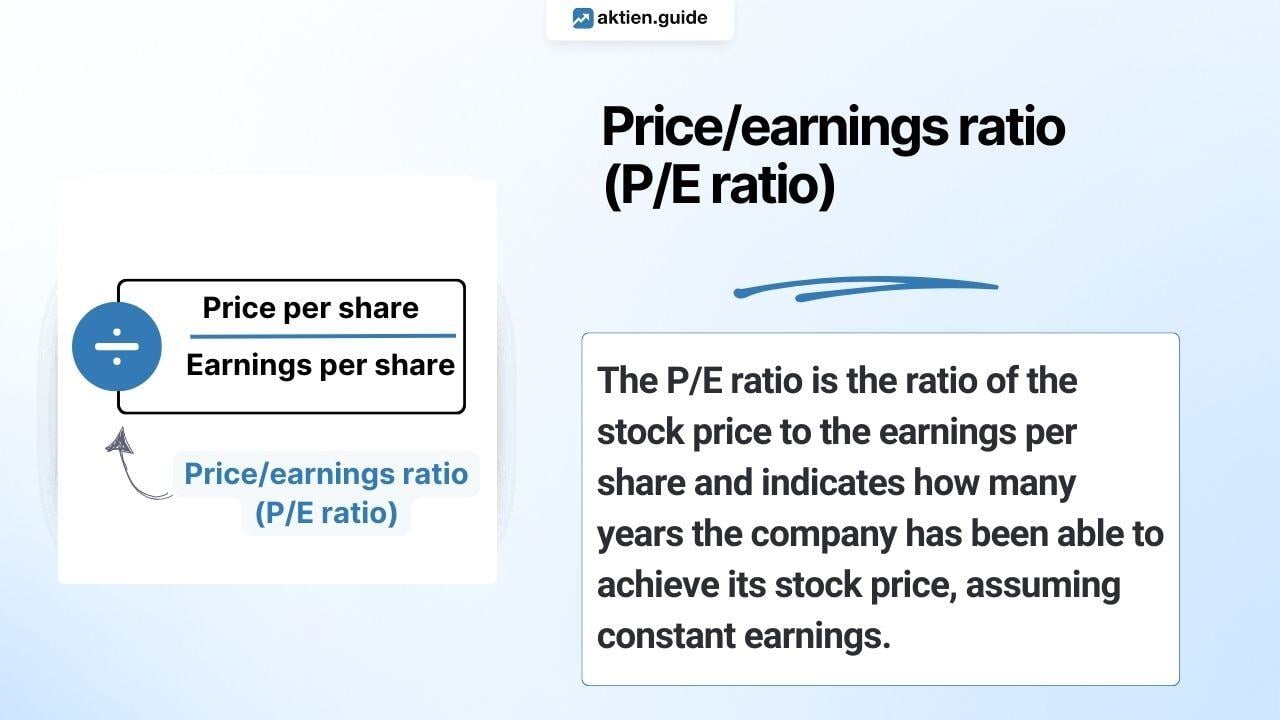
The P/E ratio (price/earnings ratio) puts the share price in relation to earnings per share (EPS). It indicates after how many years the company has earned its share price, assuming that profits remain constant.
The P/E ratio is therefore a good indicator of whether a share is expensive or cheap. According to Wikipedia, the historical average P/E ratio for DAX stocks is 14.6.
The P/E ratio is probably the best-known key figure for valuing companies. Price-earnings ratio, PER or PE for short, is the English term for the price-earnings ratio.
Different types of P/E-Ratio
In stocks.guide you will find the following different P/E ratios or price/earnings ratios: P/E ratio (TTM), P/E ratio forward and P/E ratio 5 years. Depending on your needs, one or the other “P/E ratio type” may be more suitable.
P/E-Ratio (TTM)
The P/E ratio (TTM) puts the share price in relation to earnings per share (EPS) over the last 12 months. TTM is the abbreviation for “Trailing Twelve Months”. By taking into account the last 12 months, the most recent figures from the last 4 quarterly reports are always taken into account.
P/E-Ratio forward
The forward P/E ratio describes the ratio of the share price to the expected earnings per share in the current financial year. The translation of “forward” in this sense is “forward-looking”. The forward P/E ratio is based on analysts' earnings per share estimates for the current financial year.
P/E-Ratio 5 years
The P/E ratio 5 years also describes the ratio of the share price to the earnings per share achieved or expected in a 5-year period. The figures from the past 3 financial years and the expected figures for the current and next financial year are used for the P/E ratio 5 years.
How is the P/E-Ratio calculated?
In general, the P/E ratio is calculated by dividing the company's current share price by the earnings per share. In the following, we explain the calculations of the different types of P/E ratio using Apple shares as an example.
Apple share P/E-Ratio overview

Calculate P/E-Ratio (TTM):
The current share price of the company is divided by the earnings per share within the last 12 months. The calculation of the P/E ratio (TTM) of the Apple share as at June 18, 2025 is shown as an illustration:
-3.jpg?width=884&height=196&name=Berechnung%20KGV%20(TTM)-3.jpg)
Calculate P/E forward:
The current share price is divided by the analysts' earnings per share estimate for the current financial year. The calculation of the forward P/E ratio of the Apple share as at June 18, 2025 is shown as an illustration:

For a company with rising earnings, the forward P/E ratio will therefore be lower than the forward P/E ratio (TTM). According to the Levermann strategy, the following points are awarded for the forward P/E ratio:
Apple therefore receives -1 point, as the P/E forward is more than 16.
Calculate P/E-Ratio 5 years:
The average of the earnings per share (EPS) of the last three financial years and the earnings per share estimated by analysts for the current and coming financial year are calculated. Next, the current share price is divided by the previously calculated average earnings per share.
The calculation of the P/E ratio 5 years of Apple shares as at June 18, 2025 is shown as an illustration:
Earnings per share (EPS) in USD from 2022 to 2026 = 6.11 | 6.13 | 6.08 | 7.17 | 7.78

According to the Levermann strategy, the following points are awarded for the P/E ratio 5 years:

Apple thus receives -1 point, as the P/E ratio 5 years is more than 16.
What does the P/E-Ratio mean?
The P/E ratio provides information about the valuation of a company. As the “future is traded” on the stock market, the current P/E ratio (TTM) should be viewed with caution. This is because high profits in the past cannot necessarily be extrapolated into the future. To find good stocks, it makes sense to look at the P/E ratio in conjunction with the forecast earnings. It is therefore worth taking a look at all three types of P/E ratio explained above.
Otherwise, a low P/E ratio stands for a low price and a high P/E ratio for a high share valuation. A P/E ratio of up to 12 can be described as low and anything above that as high.
When looking at the P/E ratio, it is important to take profit growth into account. Companies with rapid earnings growth are generally valued higher.
It is therefore important to look at the P/E ratio in the overall context and not in isolation. Visually cheap P/E ratios often go hand in hand with low earnings growth.
Which price/earnings ratio is to be considered favorable also depends on other influencing factors, e.g:
- Stability of earnings
- Future prospects of a company's industry
- Position of the company in this market
- speed of growth
- Business model
The P/E ratio is not the only key figure for valuing shares. The EV/Sales ratio is also suitable. This ratio is more suitable than the P/E ratio for assessing the valuation of fast-growing but still loss-making companies.
Stocks with attractive P/E ratios
The table shows mid and large cap stocks with a P/E ratio below 12 for all P/E types and an estimated earnings growth of more than 5 percent for the coming financial year.
Updated on: Wed, 18.06.2025
| Stock | P/E ratio TTM | Revenue Growth |
|---|---|---|
| Schlumberger | 11.91 | 5.76% |
| MPLX LP | 11.88 | 6.98% |
| Enterprise Products Partners L.P. | 11.87 | 9.31% |
| ACS | 11.78 |
19.65% |
| Sumitomo Electric Industries | 11.75 | 6.29% |
| Grupo Mexico | 11.71 | 15.82% |
| Western Gas Partners, LP | 11.50 | 11.48% |
| Terna | 11.24 | 14.09% |
| Diamondback Energy | 11.21 | 47.89% |
| Samsung | 10.17 | 15.35% |


%20%F0%9F%87%BA%F0%9F%87%B8.jpg)
