Table of Contents
- What is ROIC?
- Why is ROIC important?
- Example: ROIC of Microsoft?
- Why is ROIC important for value investors?
- What investors can learn from this
- Conclusion
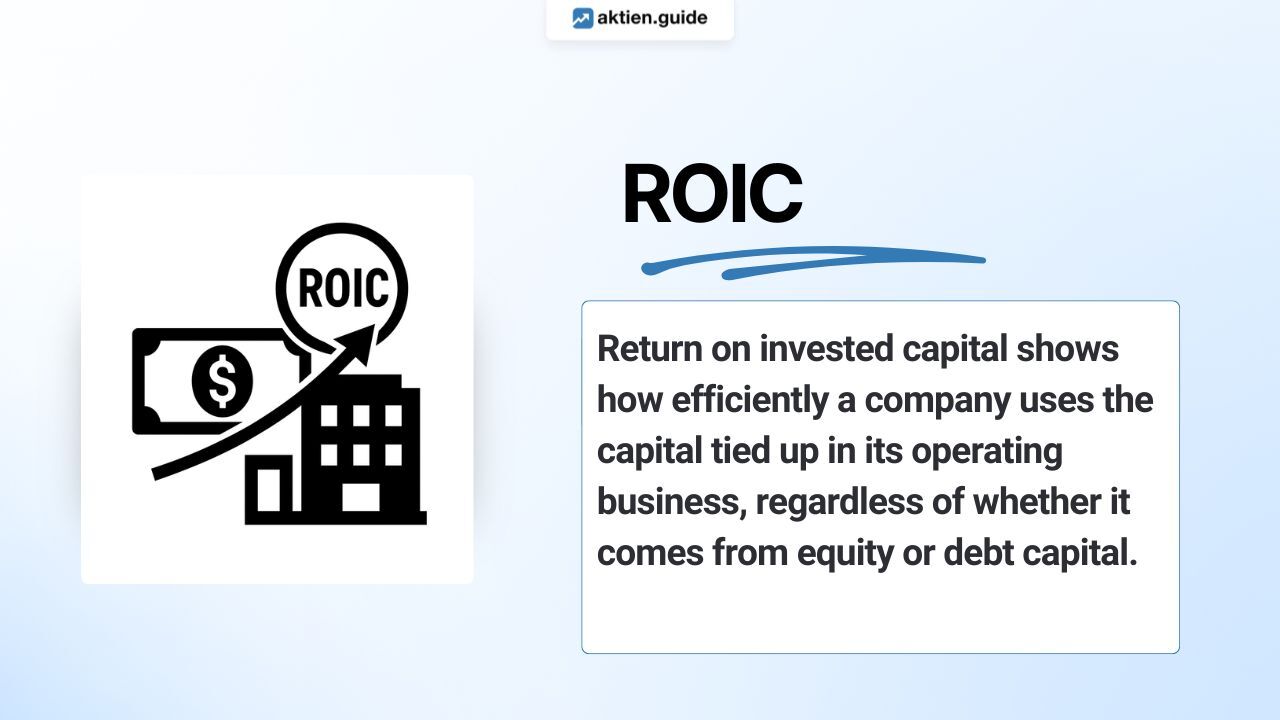
What is ROIC? 🤔
ROIC stands for return on invested capital. This key figure shows how efficiently a company uses the capital tied up in its operating business to generate profits—regardless of whether it comes from equity or debt capital.
The formula is:
ROIC = NOPAT/Invested capital x 100
- NOPAT = Net Operating Profit After Taxes
- Invested capital = capital employed
In contrast to ROCE, ROIC (return on invested capital) only takes into account operating capital invested—i.e., exclusively the capital that is used directly to generate operating profits. This makes ROIC particularly well suited for assessing the pure efficiency of the core business—independent of non-operating assets or the company's capital structure.
Why is ROIC important? ☝️
ROIC provides investors with a clear answer to the question:
“How well does a company generate profits with the capital invested?”
A high ROIC indicates that a company is using its investments particularly efficiently and achieving above-average returns. A declining ROIC, on the other hand, can be a warning sign—for example, of unfavorable investments or declining profitability in the core business.
Example: ROIC of Microsoft 📈
Microsoft is a good example of a company with a high return on capital employed. Its current ROIC is 26%.
Calculation
We calculate the ROIC of Microsoft using the familiar formula:
ROIC = NOPAT/Invested capital x 100
Step 1: Determine NOPAT
According to the current annual report, Microsoft's NOPAT is:
NOPAT = $84 billion
Step 2: Utilize invested capital
The invested capital amounts is:
Invested capital = $323 billion
Step 3: Calculate ROIC
ROIC=NOPAT/Invested capital x 100 = $84 billion/$323 billion = 26%
Microsoft therefore generates around $0.26 in operating profit for every dollar of capital invested—a strong figure that underscores the company's solid return on capital and efficiency.
Why is ROIC important for value investors? 💡
Value investors look for companies that are sustainably profitable and use their invested capital particularly efficiently. This is exactly where ROIC comes in: the key figure not only shows whether a company is making a profit, but also how much return it achieves on every dollar of invested capital.
A consistently high ROIC can indicate that a company has a robust business model, strong competitive advantages (moat), and smart management decisions. For value investors, ROIC is therefore a key indicator of true return on capital—and a strong criterion when selecting long-term investments.
What investors can learn from this 🤓
A ROIC of 26% shows that Microsoft uses its invested capital extremely efficiently. Such figures are a strong indication that the company is operating profitably and using its resources extremely effectively.

However, even a high ROIC should be monitored over time. A decline may indicate investments that are not (yet) paying off—or declining profitability in the core operating business.
Conclusion
The ROIC ratio shows at a glance how efficiently a company is working with its invested capital. It is an indispensable tool for investors—especially when comparing capital-intensive business models.
👉 How to use ROIC in stock analysis:
✅ Compare ROIC values over several years.
✅ Look for stable or rising values—an indication of efficient capital utilization.
✅ Use ROIC in industry comparisons: Which companies make the best use of their invested capital?
Tip: In the StocksGuide charts, you can compare and visually analyze the ROIC of thousands of companies at a glance. This allows you to quickly identify particularly efficient companies and make more informed decisions on the stock market.
With the StocksGuide screener, you can filter the most attractive stocks in just a few clicks—based on ROIC and over 40 other key figures.
Here you will find an overview of DAX companies and their ROIC. Take a look now!